ISO 9001:2015 clause 9.1.3 requires systematic deviation analysis – not just recording individual incidents. Many Swedish companies register deviations in AmpliFlow but rarely use the analysis tools to identify patterns.
This guide shows how to use AmpliFlow's analysis tools: find which processes generate the most deviations, where problems are detected, and how to prioritize improvement actions based on data.
Why Analysis Reveals Patterns That Individual Incidents Hide
Once your company has registered 50-200 deviations, you can start seeing patterns. The Pareto principle (80/20 rule) often applies: 20 percent of causes create 80 percent of problems.
Example: An automotive manufacturer discovered that 20 percent of design flaws caused 80 percent of crashes. When the company focused on these flaws, safety improved dramatically.
Through analysis, your company can discover that:
- A specific process generates the majority of deviations (often 50-80 percent)
- Problems are detected at customer sites instead of in production
- The same errors repeat in similar situations
AmpliFlow makes it simple. In the Improvement Dashboard, you filter and group deviations by process, severity, or affected areas. The system counts automatically and displays results as clickable charts. When you click a bar, a filtered list opens showing only those deviations (drill-down analysis).
ISO 9001:2015 clause 9.1.3 requires the analysis to determine:
- Whether products and services meet requirements
- Whether customers are satisfied
- How well the quality management system performs
- Whether planning and risk mitigation actions were effective
- Whether external suppliers perform as expected
- Which improvements are needed
Deviation analysis in AmpliFlow covers all these areas.
What Data AmpliFlow Collects
Each deviation contains system fields that enable analysis:
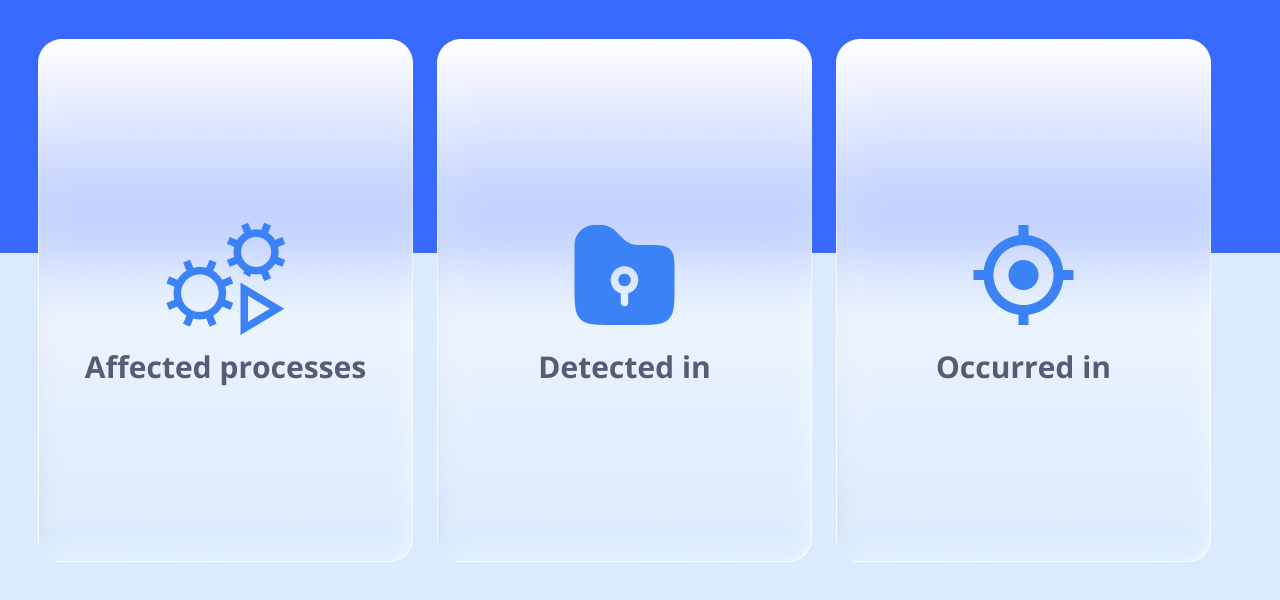
Affected processes: Which process was affected. This links the deviation to your process mapping and grants process owners access rights.
Detected in: Where the deviation was first detected – at which production stage.
Occurred in: Where the deviation originally occurred – the source of the problem.
The distinction between "detected in" and "occurred in" is critical. If a defective product is detected at customer site but occurred in production, your quality control system missed the error.
Standard fields in every deviation:
- Date: When the deviation was registered
- Affected areas: Classification according to impact matrix (delivery, environment, health and safety, savings potential)
You can also collect (if activated):
- Severity
- Consequences
- Immediate actions
- Supplier responsibility
You configure which fields to collect yourself – no technical assistance needed.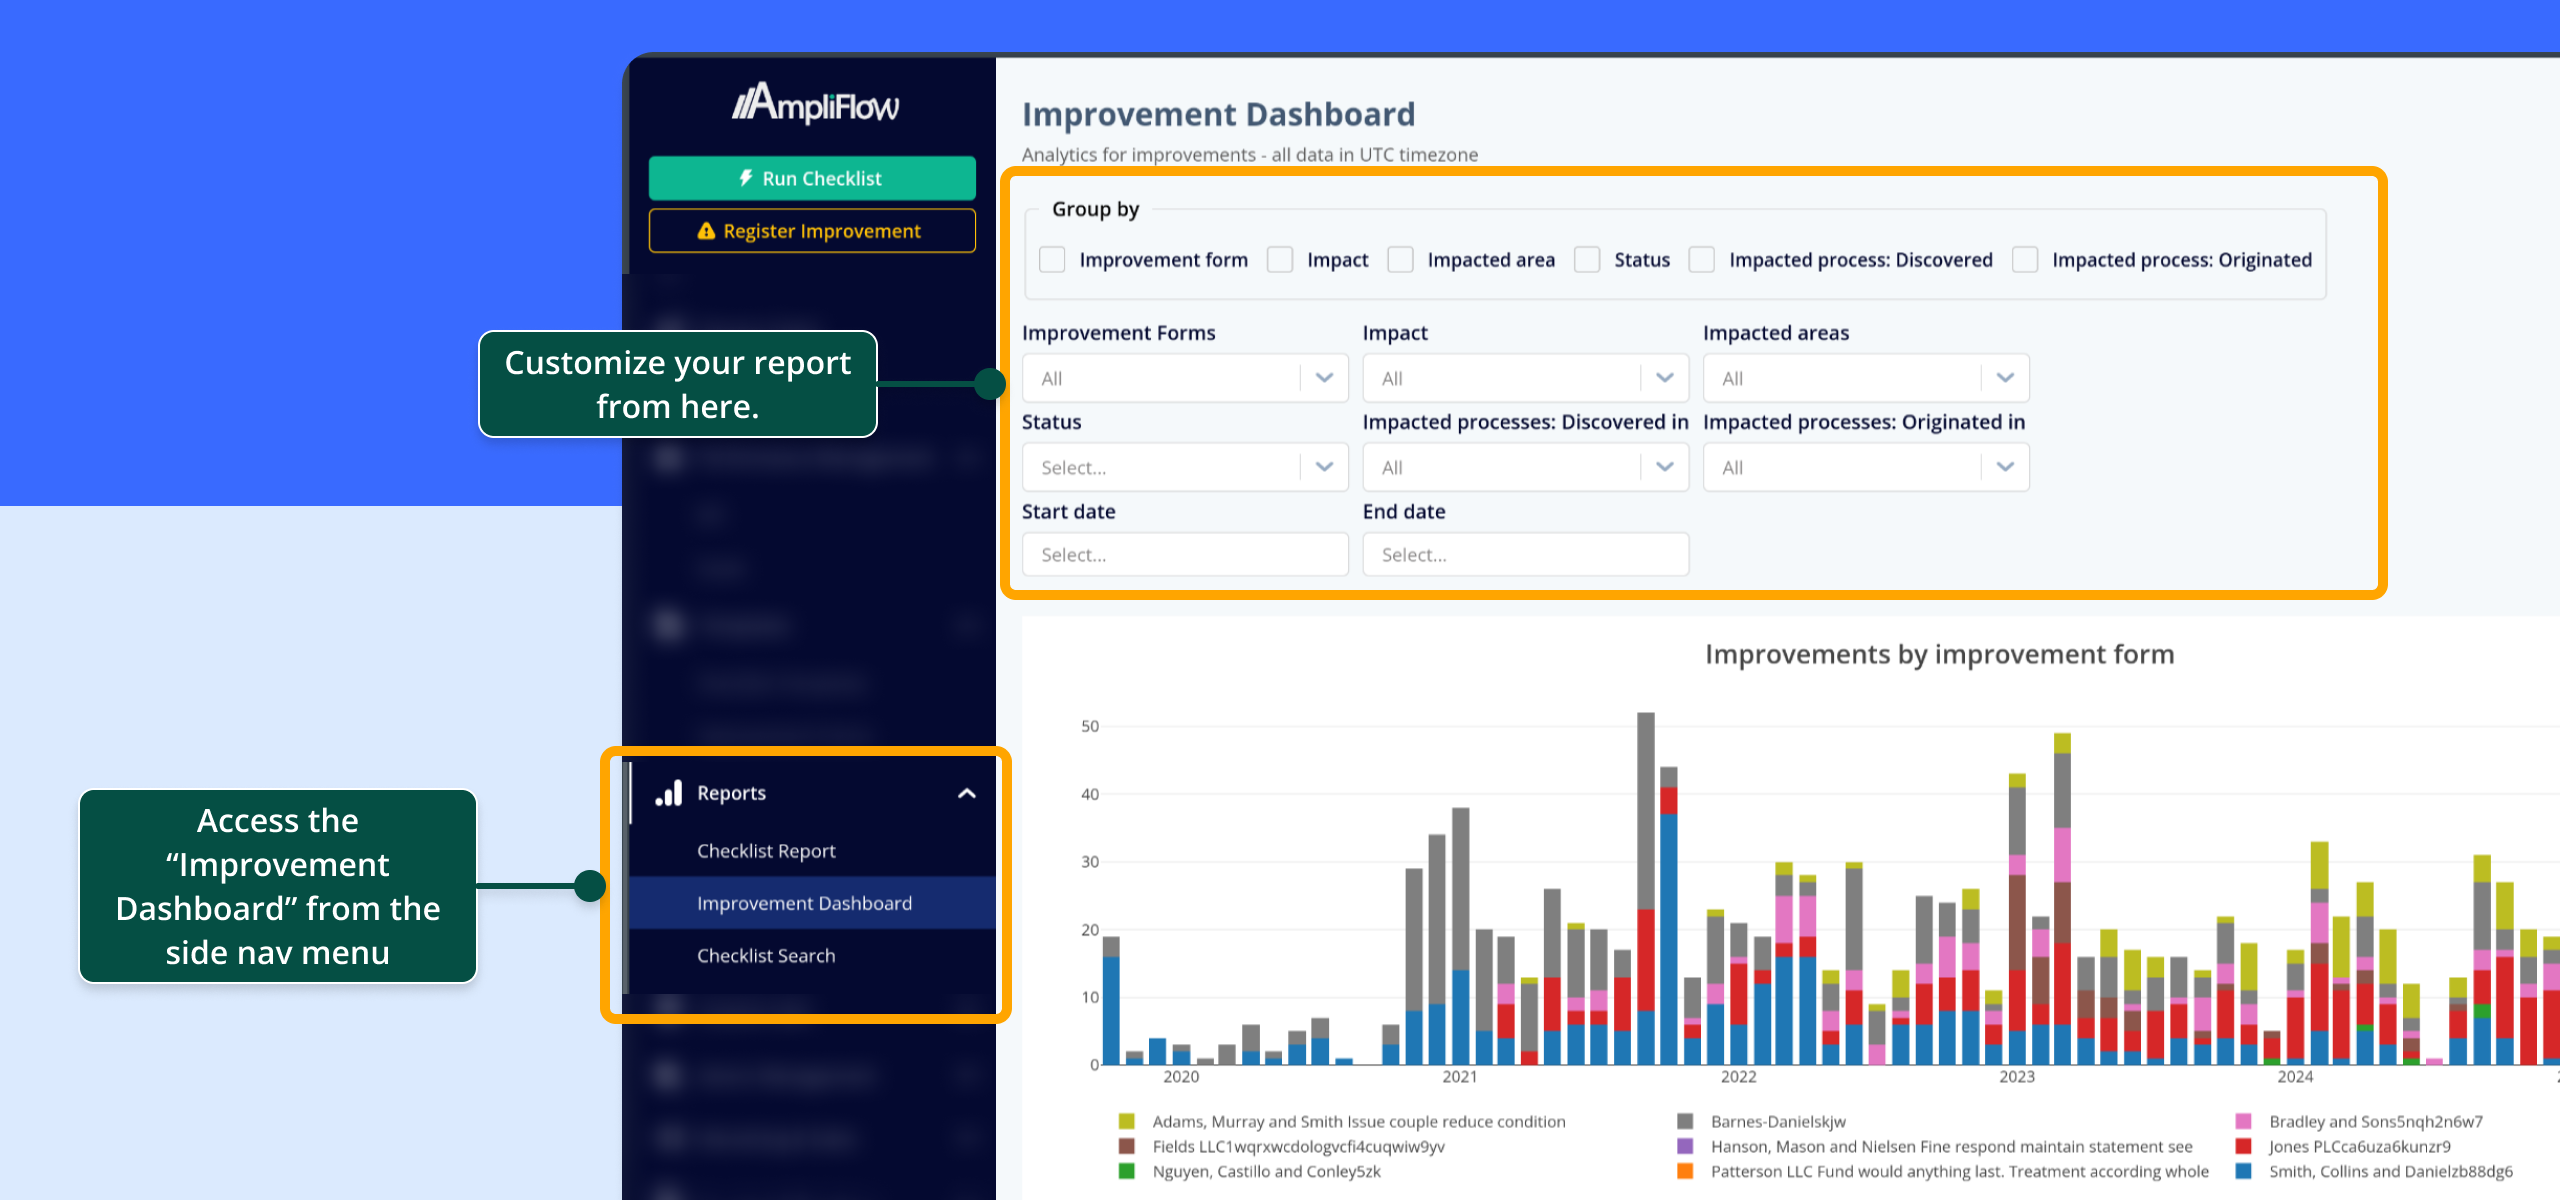
Process-Based Analysis
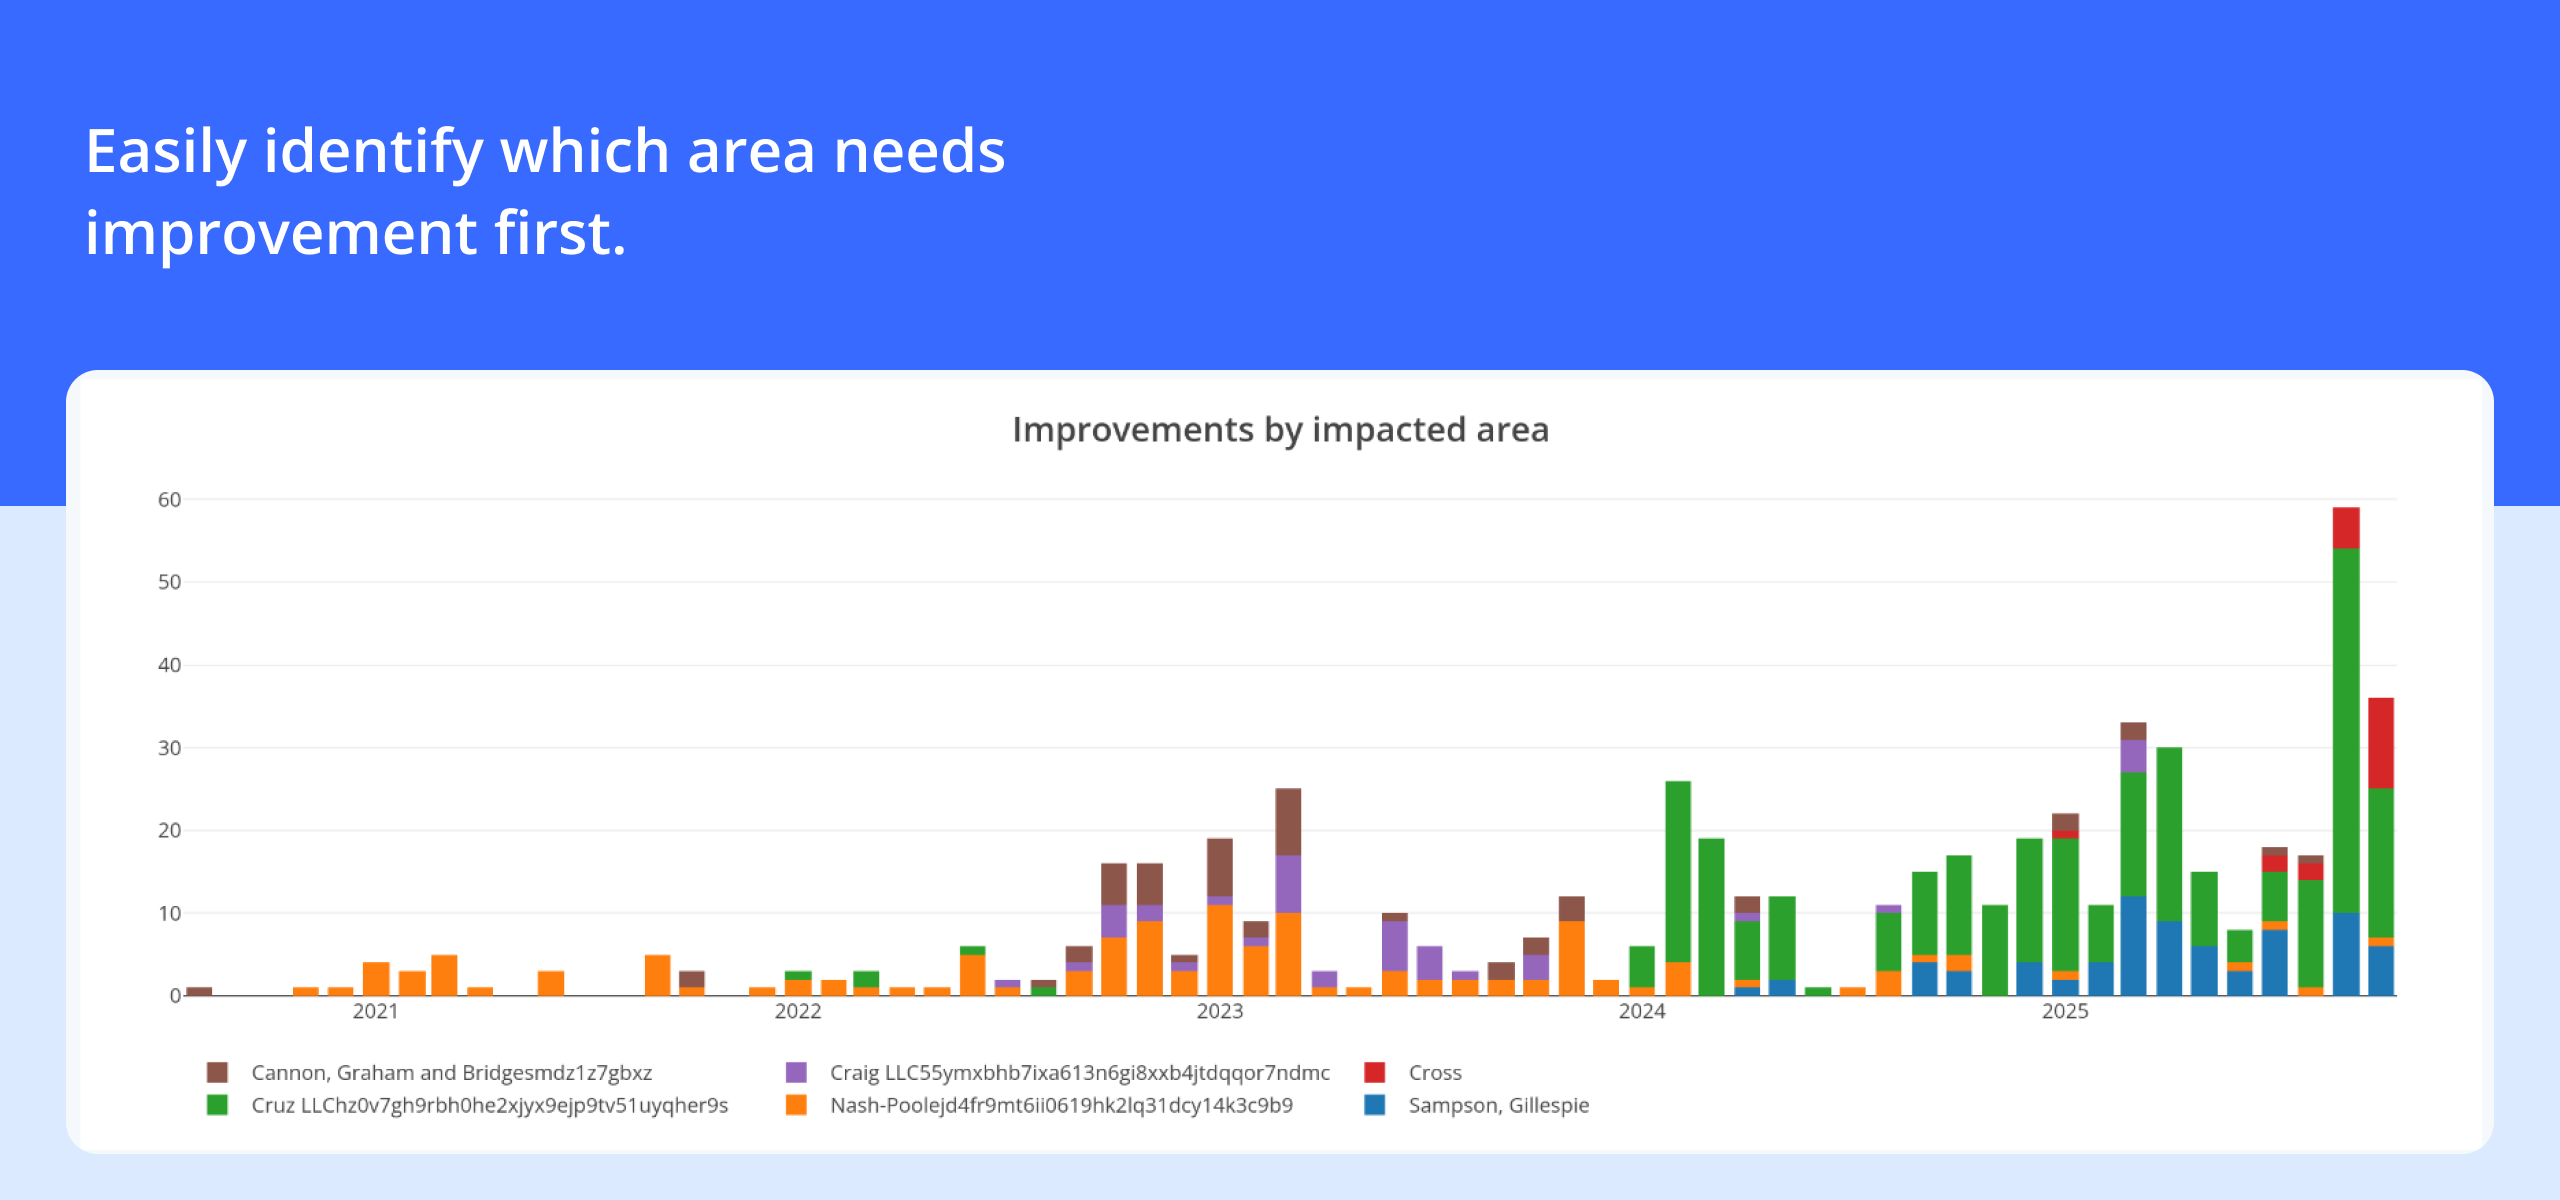
Process-based analysis shows which processes generate the most deviations – which area needs improvement first.
Step by Step
- Navigate to Improvement Dashboard: Select "Improvement Dashboard" from the main menu (or /improvement-dashboard).
- Select grouping criterion: Under "Group by", select "Affected process: Detection" or "Affected process: Origin". AmpliFlow shows how many deviations link to each process.
- Identify top performers: Which 3-5 processes have the most deviations? These are your high-priority areas.
- Compare with process mapping: Open your process mapping and study the processes with the highest deviation counts. Is the process complex? Does it involve many suppliers? Are instructions unclear?
- Analyze trends: Has the count increased or decreased in recent months? An increasing trend requires immediate action.
Interpret Results
Many deviations in a process may mean:
- The process is complex and risk-sensitive
- Instructions are unclear
- Staff need training
- Equipment functions poorly
- Many involved parties create communication problems
Few deviations may mean:
- The process works well (positive)
- Staff don't report (problematic)
- The process is rarely used
Verify that low numbers are due to good quality, not poor reporting.
Example: A manufacturing company discovered that 45 of 78 deviations (58%) occurred in the assembly process. 32 deviations (71%) were first detected at final inspection. The company moved quality controls to the middle of the process. In three months, deviations decreased by 65 percent.
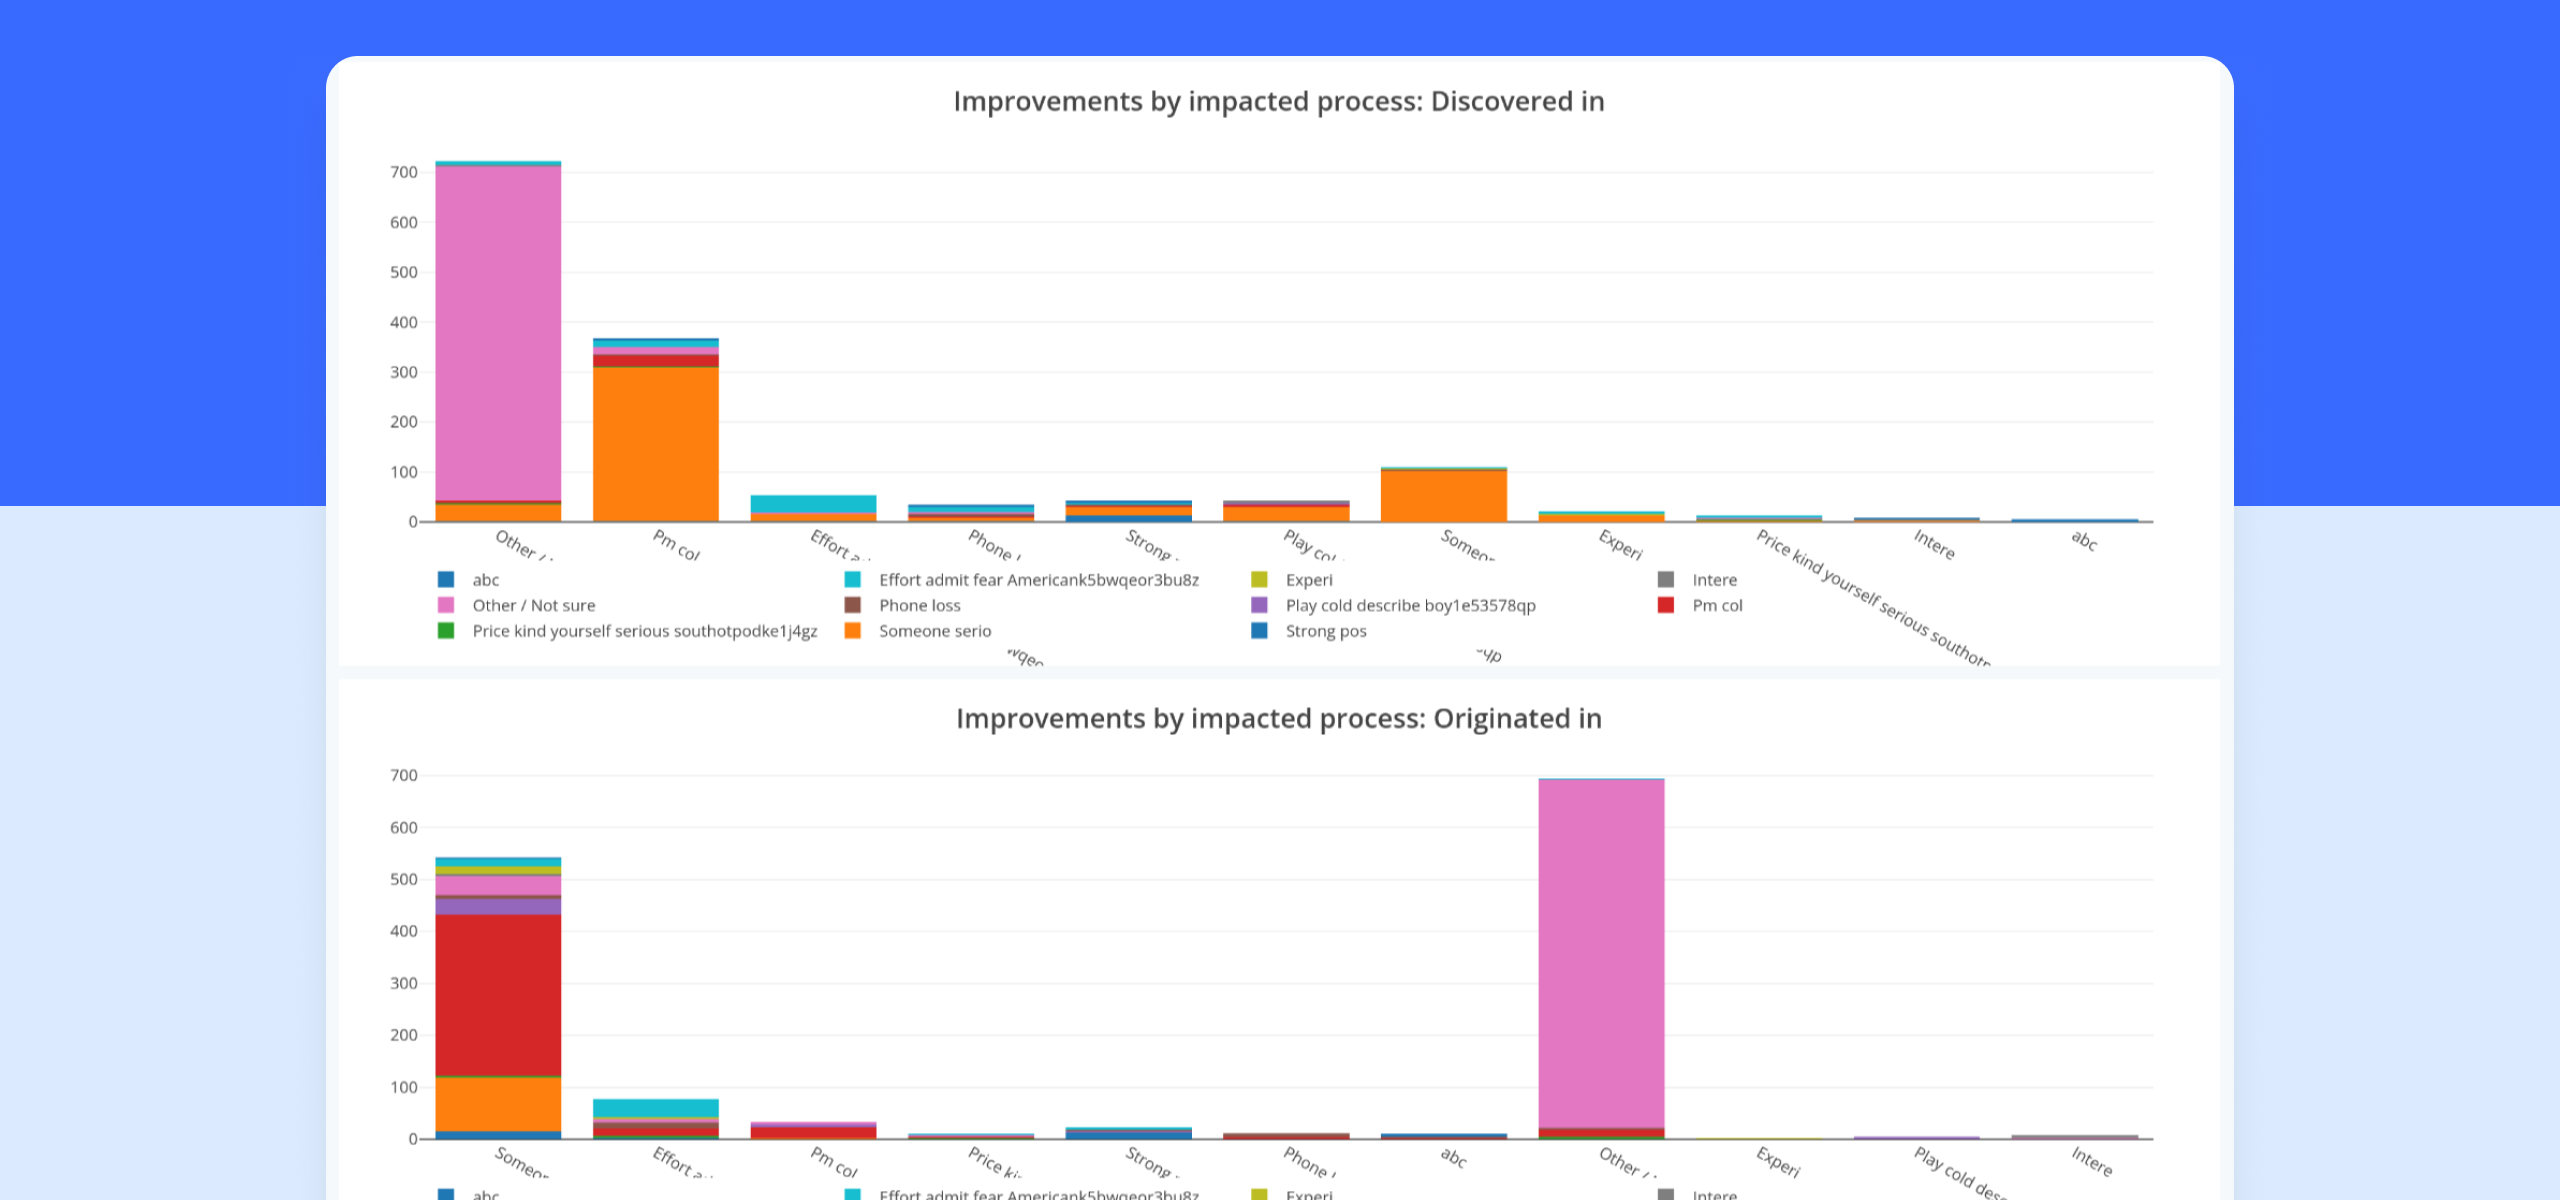
Detection Point Analysis
Detection point analysis shows where problems are identified – are they detected too late or too early in the production chain?
Step by Step
- Filter by "Detected in": Group by the "Detected in" field instead.
- Identify patterns:
- Detected at customer? (too late – quality control missed)
- Detected at final inspection? (reasonable, can be improved)
- Detected in production? (good – early detection)
- Detected at receiving inspection? (excellent – catches supplier problems early)
- Cross-analyze "Detected in" and "Occurred in": Shows whether quality controls catch errors at the right stage.
- Evaluate effectiveness: Calculate the proportion detected internally vs. externally (at customer).
Interpret and Act
High proportion at customer:
- Internal controls too weak
- Strengthen quality control points
- Train staff in deviation handling
- Clarify customer requirements
High proportion in production:
- System works (catches early)
- Analyze root causes
- Prevent rather than just detect
High proportion at receiving inspection:
- Supplier problems dominate
- Focus on supplier management
- Consider alternative suppliers
Example: 45 of 78 deviations (58%) were detected in production. Of these, 32 (71%) occurred in supplier receiving. The company changed from 10% sampling to 100% inspection of critical parameters. In six months, production deviations decreased by 65 percent.
Combine the Analyses
Prioritization Matrix
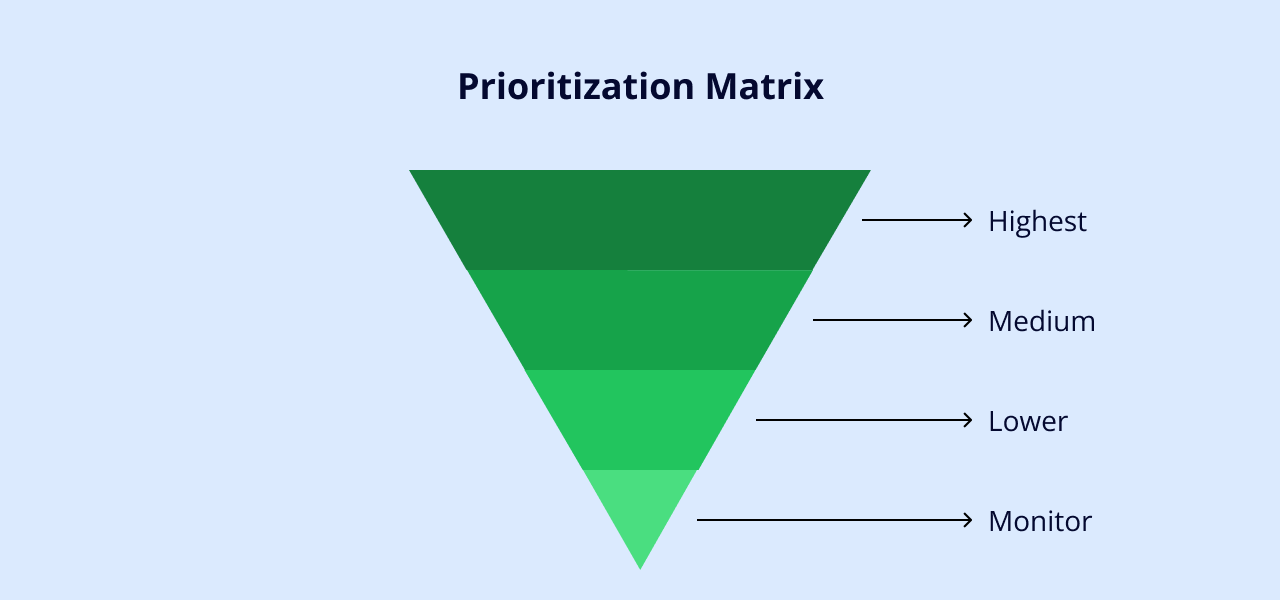
After both analyses, prioritize as follows:
- Highest: Processes with many deviations detected at customer (major consequences + high volume)
- Medium: Processes with many deviations detected internally (high volume, lower consequences)
- Lower: Processes with few deviations
- Monitor: Processes where deviations decrease after actions
This follows the Pareto principle (20% causes → 80% problems) and ISO 9001:2015 risk-based thinking.
Present to Management
ISO 9001:2015 requires management review where deviation data is analyzed. Include:
- Total deviations since last review
- Top 5 processes with most deviations and trend
- Distribution of detection points (internal vs. external)
- Implemented actions and results
- Recommended next steps
Use visual formats: bar charts (per process), pie charts (detection points), trend lines (over time).
Example of data-driven recommendation:"The assembly process generates 45% of all deviations. We recommend 80,000 SEK in equipment and training. Expected result: 60-70% reduction within six months, saving 200,000 SEK annually in rework."
This shows:
- Where the problem exists (data)
- What the action costs (budget)
- Expected result (experience-based)
- Economic justification (ROI)
Common Mistakes
Collect data but never analyzeISO 9001:2015 requires analysis – not just collection. Schedule 2-3 hours per quarter for analysis.
Analyze too few data points5-10 deviations give misleading results. Wait until sufficient data exists.
Ignore positive trendsIncreasing reporting is often positive – staff report instead of hide. Compare internal vs. external detection.
Focus on many small problemsFollow Pareto: 80% resources on 20% causes (3-5 processes with most deviations).
Forget the PDCA cycleRun the same analysis after 3-6 months. Did deviations decrease? If not, try another action.
Make It Routine
Quarterly routine (week 1):
- Process-based analysis (30 min)
- Detection point analysis (30 min)
- Document top 3-5 priorities (30 min)
- Meeting with process owners (1-2 hours)
Week 2-10: Implement actions
Week 11-12: Prepare and present to management
Annual deep analysis:
- Compare all four quarters' data
- Identify seasonal variations
- Calculate deviation costs
- Document action effectiveness
Integrate with ISO 9001:
- Clause 6.1 (Risk Management): Identify risks from patterns
- Clause 9.1.3 (Analysis): Fulfill data analysis requirements
- Clause 9.3 (Management Review): Deliver concrete evidence
- Clause 10.3 (Continual Improvement): Prioritize data-driven
Summary
Deviation analysis moves your company from reactive firefighting to proactive, data-driven improvement. Instead of handling each deviation in isolation, you see patterns that reveal system problems.
Key Points:
- ISO 9001:2015 requires analysis, not just collection
- Pareto: 20% processes create 80% problems
- Process-based analysis shows which processes need improvement
- Detection point analysis shows whether controls catch problems early
- Present number-based recommendations to management
- Make analysis a quarterly routine
Start small: Schedule 60 minutes next week for your first process-based analysis. Identify your top 3 processes with the most deviations.
References
ISO 9001:2015International Organization for Standardization. (2015). Quality management systems — Requirements (ISO 9001:2015).https://www.iso.org/standard/62085.html
Pareto Principle in Quality ImprovementJuran, J. M., & Godfrey, A. B. (1999). Juran's Quality Handbook (5th ed.). McGraw-Hill.
Related Articles:
- What is Deviation Management? - Basic introduction if you're new to the field
- Guide to Deviation Management in AmpliFlow - How to set up the system for data collection
- Deviation Management: Key to Continuous Improvement and Increased Customer Satisfaction - Strategic context
Need Help?Contact AmpliFlow support at support@ampliflow.se or visit [www.ampliflow.se/support]


